

Painted into a corner?
Was the ‘realignment’ just a pet theory?

.svg")
With Labour achieving enormous poll leads following the Tory chaos over the summer, many have revised or disparaged the idea that British politics has undergone a realignment. Below are a few thoughts about this, as someone who still has some time for the idea.
What is/ was the realignment?
My understanding, when people talked about a UK political realignment in the 2010s, was that they described a sea-change shift — away from economics as the central fault line of the Labour-Tory divide, and towards social attitudes.
Brexit was regarded as both a catalyst and a consequence of this, creating new tribes — i.e. Labour Leavers and Tory Remainers — who lacked clear representation. And the Red and Blue ‘walls’ were the battlegrounds where this played out. Voters in the former tended to be economically left-wing but socially more conservative (and pro-Brexit). Those in the latter were roughly the reverse.
Brexit was pivotal, because it forced the Conservatives to decide between social conservatism and economic pragmatism; between ending free movement and staying in the single market. They prioritised the former — relinquishing the economic upsides of integration with other countries and surrendering in the process their claims to be the party of economic growth, risk aversion and ‘sound money’.
(It’s worth noting that many of Brexit’s strongest Tory advocates did not believe this was what they were doing. They were economic libertarians, and mistook the referendum result for an endorsement of their niche ideology).
Labour, meanwhile, faced choices of their own — about where they stood on immigration, and on broader ‘values’ questions like the Union Jack. These had lingered for some time thanks to the overtures of Ukip, but moved centre-stage post-Brexit.
The Tory Party were generally seen as net beneficiaries of the realignment, because the socially conservative voters they were attracting are spread in a more electorally ‘useful’ way — outside big cities. The 52% who voted Leave translates, in our First Past The Post system, into 64% of constituencies.
Hence, while the the tectonic plates were moving anyway, the Conservative goal became, post-2016, to accelerate the shift. The Boris Johnson strategy relied on creating and amplifying divides based on social issues (e.g. the Rwanda policy). These aimed to further break apart the Labour coalition of cosmopolitans and communitarians. Consciously or unconsciously, this approach accepted as collateral damage the departure of liberal Tories.
The table below tries to show this, in the roughest of terms. It uses 2016 Brexit vote as a very crude proxy for where a constituency sits on the social axis, and 2019 deprivation score as an even cruder proxy for where it might be on the economic gamut (by assuming that more deprived places are generally more left-wing).
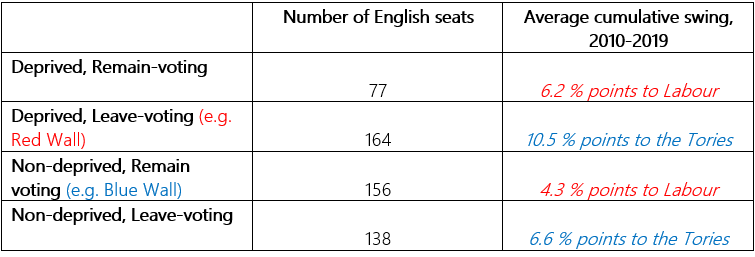
It therefore identifies four groups of seats:
economically left, socially liberal (above average deprivation, below average Leave vote);
economically left, socially conservative (above average deprivation, above average Leave vote (e.g. Red Wall));
economically right, socially liberal (below average deprivation, below average Leave vote (e.g. Blue Wall));
economically right, socially conservative (below average deprivation, above average Leave vote).
The table shows the cumulative swing to and from the main parties for each of these groups, between 2010 and 2019. It shows that social values, insofar as they can be assumed on the basis of Brexit vote, have been fairly instrumental in determining which direction seats have moved. More instrumental than economics.
This, in a nutshell, is the realignment as I understand it — an increasing emphasis on social attitudes as a fault line between the parties
How did the realignment affect politics?
Let’s rewind a bit. The diagram below (Diagram 1) illustrates the political spectrum as it’s often represented, with the vertical axis showing social attitudes and the horizontal axis showing economic positions. It envisages (in a very simplified way) where the two parties might have presumed to draw their traditional support.
It depicts the Tories attracting both socially conservative and socially liberal voters from the economic right, and Labour doing the same on the economic left. The Red and Blue ‘walls’ are sketched in. (I mention these ‘walls’ throughout this blog, as a shorthand for the socially conservative left and the socially liberal right, respectively).

The next diagram (Diagram 2) shows where the new basis of support for the parties was expected to lie, in a fully ‘realigned’ politics. It depicts the Tories as the party of social conservatism, regardless of economic interest, with Labour the party of social liberalism.
This is the end-point which many academics charting the realignment foretold— and which a few became deeply invested in. And it’s what Tory populists like Boris Johnson (and before he left Dominic Cummings) seemed to be shooting for. Theresa May was also aiming for this, but lacked the ruthlessness, recklessness and charisma to deliver it.

Between these two situations (Diagrams 1 and 2) there exists a period of flux in which the realignment is/ was actually happening. This period began in earnest in June 2016 — the point when Labour Leave and Tory Remain voters started to be ‘up for grabs’. These two groups were to become completely un-moored from their former political representatives in the coming years, as the 2019 European Elections showed.
The next image therefore (Diagram 3) depicts political reality in the medium term, post-referendum. Both top right and bottom left areas are highly fluid here. In particular, the Conservatives were actively courting pro-Brexit Labourites in the Red Wall.

This part of the spectrum was indeed open to capture, as we saw in December 2019. And Boris Johnson was an asset to the Conservatives here, annexing the bottom left quarter in a way that few Tories could have done. The ‘levelling up’ slogan comprised the economic part of his effort to lock these seats in, post-election. And the ‘culture war’ fixation comprised the social element.
The Conservative hope was that, having done this, they could shore up the top right section . This would give them a huge coalition to draw on, penning Labour into metropolitan enclaves. It was a hope which looked, before party-gate, to be being realised.
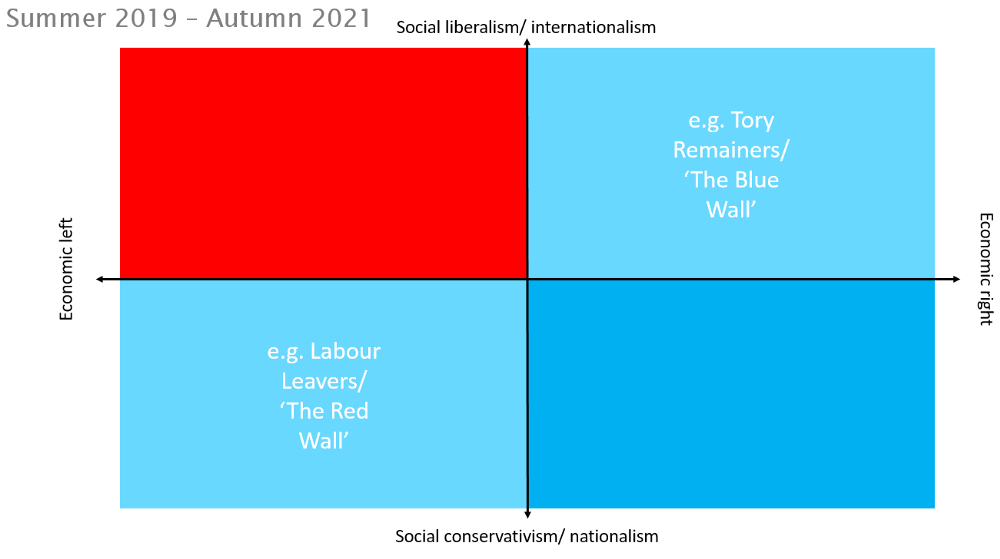
The next image (Diagram 4) illustrates how the realignment appeared to be going between Summer 2019 and Autumn 2021. This time-frame starts when Johnson becomes Conservative Leader, and includes the 2019 election. It continues throughout 2020 — with daily politics paused by COVID-19 and with Keir Starmer’s ‘under new management’ message yet to cut through.
The 2021 Hartlepool by-election was arguably the apogee of this. It seemed to signify that the Johnson strategy was working.
The under-priced (or perhaps over-priced) factor in Boris Johnson’s strategy was Jeremy Corbyn. Corbyn’s social and international attitudes were toxic for many Red Wallers, and drove a significant number to the Conservatives. But he was also economically terrifying enough (and, in fact, Eurosceptic enough) to stop Blue Wallers from playing their own role in the realignment. Instead, many voted Tory through gritted teeth in 2019.
Corbyn’s presence and its aftermath therefore masked how fragile the coalition in Diagram 4 really was. It made a fleeting alliance seem impregnable, and gave many Tories a false sense of security.
In particular, Blue Wall disillusionment with the Conservatives remained strong. This was thanks to the party’s “f**k business” ethos, but also to commuter belt areas getting younger and more diverse. Liberal Tories weren’t necessarily all so exercised about refugee policy or trans rights that they’d change their vote on the basis of these issues alone. But they could tell that the Conservatives were abandoning economic pragmatism to fight battles which Blue Wallers didn’t much care about.
Hence, the Johnson strategy was risky. It jeopardised part of the historic Tory base, to pursue hard Brexit and an attendant set of social policies. It did this to attract voters who were electorally lucrative, but who had no residual loyalty to Toryism. By leaning so heartily into this, Johnson put not one but two quarters of the spectrum ‘in play’ (top right and bottom left). And, having believed they could capture both, the Tories didn’t allow for the possibility that they might end up with neither.
Following Johnson’s departure and the election of Liz Truss, this came to pass. Truss effectively played the role of a reverse Corbyn, repelling Labour Leavers and Tory Remainers in equal degree.
Indeed, Truss’s mini-budget was perfectly pitched to achieve this: tax cuts for the rich to enraged Red Wallers, alongside a lack of fiscal restraint to panic Blue Wallers. Cultural issues could no longer mobilise the former; lingering hopes that the Tories were ‘on their side’ in economic as well as social terms were extinguished. And the latter had their own suspicions confirmed: that the Conservatives had become socially conservative culture warriors and economic isolationists.
Labour, in the meantime, had done enough work that they were a viable opposition for both tribes. The image below (Diagram 5) visualises the consequence of this, with Keir Starmer making major in-roads with top right as well as bottom left, according to polls.

If an election happened tomorrow, the Conservatives could be left with only a small patch of the spectrum to rely on — an economically and socially right-wing section of opinion, which is itself shrinking over time. Talk of a 1997 style wipe-out for them is not unrealistic. And, whilst Rishi Sunak seems more likely than his predecessors to steady Blue Wall nerves, the rhetoric of Suella Braverman and co could offset this.
Indeed, part of the problem for parties navigating the realignment is that you can go from expansion to contraction very fast. (Herein lies a lesson for Labour). The Conservatives were, not so long ago, winning Red Wallers through conservative cultural stances and holding Blue Wallers through non-re-distributive economics. They’re now losing the former group thanks to the latter policies and the latter group thanks to the former. They moved, in the course of less than 18 months, from dominating three quarters of the spectrum to being guaranteed just one. It is only through a double-edged capitulation of this type that a party can go, in less than three years, from a 90 seat commons majority to an electoral forecast of just 61 seats.
A pet theory?
Labour’s recent dominance in the polls is not, in my view, proof that the realignment was a pet theory. Rather, both main parties have been involved in a rotating courtship with different voter groups since at least 2016, motivated by an awareness of how important (and potentially divisive) differing social values have become.
This was based on perpetual trade-offs between economic and social approaches; on continually revised deductions about whether to ‘lean into’ the realignment or try and reverse it. The present Conservative predicament is the consequence of Johnson betting the ranch on one aspect of the realignment, and leaving his party high and dry in the process.
The image below (Diagram 6) shows how, I would say, Labour and the Tories are now aligned. (As with the other spectrums, it depicts where their core support lies, rather than vote share). This is different from the first spectrum (Diagram 1), because it’s no longer primarily economic. But nor has it become purely social (as per Diagram 2).

Labour’s areas of greatest strength are now inner-city areas, but specifically those which are socially liberal and economically left-wing. Between 1997 and 2019, for example, Hackney South and Shoreditch went from being Labour’s 130th biggest English majority over the Tories to being its 6th. Leave-voting Easington in County Durham, by contrast, went from first to 111th.
The Tories, meanwhile, are increasingly strong in areas which were socially conservative as well as economically right-wing. Between 1997 and 2019, Rayleigh and Wickford went from being their 150th biggest English lead over Labour to being their first. Remain-voting Winchester, conversely, dropped from third to 57th.
The next table again takes the ultra-crude measures of Brexit and deprivation, to look at movements between the parties since 1997. It compares the two parties’ 20 biggest leads over one another in 1983, 1997 and 2019, looking at the averages for Leave vote and deprivation score.
This is very simplistic, as we’re applying data from the late-2010s to seats as they were 30 years before. But (insofar as it shows anything) it suggests that, while Labour’s base became much less Brexit-inclined and the Tories’ a little more so during this period, there was a lot less change in terms of deprivation.

The two charts below cover the same timescale. They look at 350 English seats which were contested, on their current boundaries, at every election between 1983 and 2019. The first shows the rankings of the 100 safest and least safe among these for Labour in 1983, and how they have shifted since then, in terms of where they ranked.

The second shows the same thing in reverse: the 100 safest and least safe for Labour in 2019, and how they had progressed in the safeness rankings since 1983. It is hard to argue, on the basis of these, that there’s been no realignment at all— although at what point it began to really snowball is hard to say.

Will the changes shown above fully reverse at the next election, thanks to the cost-of-living and the reassertion of economic priorities over social ones? Will Easington and Winchester respectively go back, in 2024, to being among Labour and the Tories’ very strongest seats?
Personally, I suspect not. Whilst the realignment was seized upon by the Conservatives as a political solution — an audacious, back-door alternative to Cameronism — it is in fact rooted in social, economic and geographical factors which go far deeper and have existed for far longer. These include, in no particular order:
industrial decline from the 1980s onwards;
the growing regional inequality between big cities and everywhere else;
high rates of migration, occurring in the first instance in urban centres and happening much more gradually elsewhere;
gentrification and the growing appetite for city living among young professionals;
the rapid ascent of post-materialist values (especially among the rising number of middle-class graduates).
These sorts of factors create very different life experiences, attitudes and priorities in different places. Housing deprivation is acute in cities but comparatively much less so in towns, for example. Employment deprivation follows the reverse pattern. Hostility to migration is lowest in the places where migration has been a fact of life for longest. Etc etc.
Thanks to these sorts of shift, Labour’s ‘heartlands’ have moved from industrial strongholds to educated inner-cities in the past few years. This may be academic if the party is winning everywhere, but that doesn’t mean it’s no longer true.
Critics of the realignment idea are right to say that it has died as a successful populist strategy for the Tories. Indeed, the Conservatives’ pursuit of it has painted them into an electoral corner that it’s hard to see a way out of for them. But the factor which made this strategy viable in the first place — namely an electoral map increasingly influenced by regional inequality — remains very much alive.